Swing Highs and Lows
The first thing that we need to recognise is what is a Swing High and Swing Low. This is probably the easiest part of price action and bar counting although the whole process gets easier with practice.
I define a swing high as;
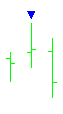 A three bar combination
A bar preceded and succeeded by lower highs
I define a swing low as;
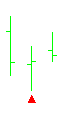 A three bar combination
A bar preceded and succeeded by higher lows
Market Phases
There are only three ways the market can go;
With the swing high/low definition now in mind we can start to build some layers on to the chart to identify these market phases and start to do a simple count of these swing highs and lows.
In short
- The market is going up when price is making higher highs and higher lows
- The market is going down when price is making lower highs and lower lows
- The market is going sideways when price is not making higher highs and higher lows OR lower highs lower lows
This may sound like child's play and a statement of the obvious but you will be surprised at how often people will forget these simple facts. One of the biggest questions I get asked is, which way is the market going? By doing a simple exercise you can see which way that price is going and decide on your trading plan and more importantly timing of a trade.
What do I mean by timing? It may be that you are looking for a shorting opportunity as the overall trend is down but price on your entry time frame is still going up (making HH's & HL's). There is, at this stage, no point in trying to short a rising market until price action start to point down (making LH's & LL's. More on this shortly).
Bias Changes
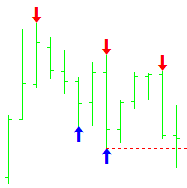
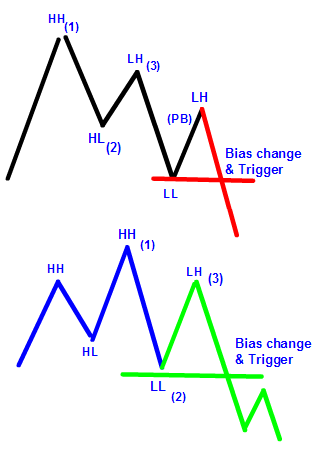
A Short or Bearish Bias Change occurs when the following sequence develops.
HH>HL>LH>LL>LH The bias change is confirmed when price moves below the las lower low made as highlighted on the chart.
Another way of saying this is 123 reversal and you are trading the pullback as your entry trigger (Red Line).
There are a few variations of this pattern but this is quite simply a price action bias change in its simplest form.
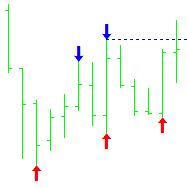
A Long or Bullish Bias Change occurs when the following sequence develops.
LL>LH>HL>HH>HL The bias change is confirmed when price moves above the last higher high made as highlighted on the chart.
Another way of saying this is 123 reversal and you are trading the pullback as your entry trigger (Blue Line).
There are a few variations of this pattern but this is quite simply a price action bias change in its simplest form.
Trending Price Action
After a bias change has been seen and confirmed, one of the phases that the market can then take is to start trending either up or down depending on the bias change previously.
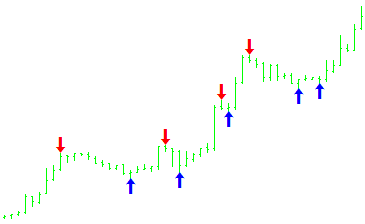
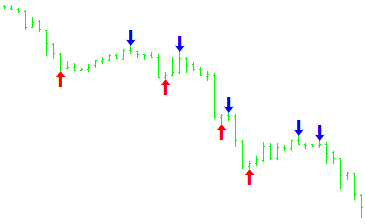
In the chart below we can see what price ideally looks like when price is trending up and trending down. Each phase shows price making HH's & HL's on its way up and LH's & LL's on its way down.
Ranging Price action
Now this is where the chart can become interesting. By using the price action counting of the swing highs and lows we can know at a very early stage IFprice is going to start to develop range bound activity.
- Price is not making new highs OR new lows
I don't mean all time highs/lows or new day/week/month highs/lows... just simply a new chart swing high or low. Price will start to stall and not make a new swing high/low and typically will stay contained within the last swing high and low that was made on the chart. Isn't that a simple definition?
Range rule definitions
- Price doesn't make a new high or low on the move
- If price stays contained within the last swing high and swing low to be made, price will remain range bound until it makes news move highs or lows.
- Price confirms the range when a lower high and a higher low is made within the previous swing high and low.
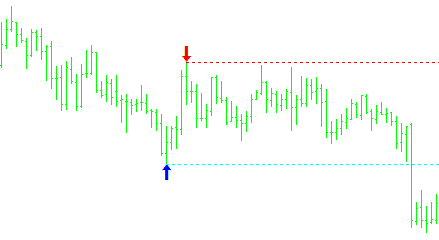
In the chart below you can see that from the left side of the chart price is making LH's & LL's all the way to the first blue arrow which in real time would be the latest lowest low. Price then moves higher to make a HH. These two swing levels have been highlighted.
At the point of the chart, in real time, price needs to either start moving higher past the last swing high (red Arrow) making a new high OR move lower past the last swing low (blue arrow) making a new low. Until either of those things happens price will most likely remain range bound. In this example that is what happened.
Range considerations
Some considerations for identifying ranges at an early stage in real time are;
- That price could be creating a pullback or bias change and as the chart unfolds for you a new high or low could be made voiding the potential range.
- There are several definitions of a range one of the more common ones is that you are looking for a double touch of support and resistance. For me this is a little too late in the game as price may not create the double touch as in the example above. With this price action method you can identify the possibility of a range developing VERY early without having to worry IF price does or does not give you the double touch. As you can see with that definition you would interpret that price is not range bound at all but, you can clearly see visually that price is moving sideways without any definition.
What you should have learnt from this short article
- A simple rule defined method to identify swing highs and lows
- How to use this swing high/low definition to interpret price action market phases
- How to identify a bias change
- How to identify trending price action
- How to identify Range bound price action
Bias Change pattern variation
In the below images we can see the pattern variation and compare them to the outlined pattern above. The only main difference is that you are looking for a breach of a previous swing high or low as the first qualifier to indicate a potential bias change. |
|
Acronyms used
- HH - Higher High
- HL - Higher Low
- LH - Lower High
- LL - Lower Low
By Philip Newton